Imports
import pandas as pd
import numpy as np
import matplotlib.pyplot as plt
from pandas.plotting import scatter_matrix
import seaborn as sns
Read the Diabetes Dataset
df = pd.read_csv ('diabetes_012_health_indicators_BRFSS2015.csv')df.shape(253680, 22)df.info()<class 'pandas.core.frame.DataFrame'>
RangeIndex: 253680 entries, 0 to 253679
Data columns (total 22 columns):
# Column Non-Null Count Dtype
--- ------ -------------- -----
0 Diabetes_012 253680 non-null float64
1 HighBP 253680 non-null float64
2 HighChol 253680 non-null float64
3 CholCheck 253680 non-null float64
4 BMI 253680 non-null float64
5 Smoker 253680 non-null float64
6 Stroke 253680 non-null float64
7 HeartDiseaseorAttack 253680 non-null float64
8 PhysActivity 253680 non-null float64
9 Fruits 253680 non-null float64
10 Veggies 253680 non-null float64
11 HvyAlcoholConsump 253680 non-null float64
12 AnyHealthcare 253680 non-null float64
13 NoDocbcCost 253680 non-null float64
14 GenHlth 253680 non-null float64
15 MentHlth 253680 non-null float64
16 PhysHlth 253680 non-null float64
17 DiffWalk 253680 non-null float64
18 Sex 253680 non-null float64
19 Age 253680 non-null float64
20 Education 253680 non-null float64
21 Income 253680 non-null float64
dtypes: float64(22)
memory usage: 42.6 MB
df.isnull().sum()Diabetes_012 0
HighBP 0
HighChol 0
CholCheck 0
BMI 0
Smoker 0
Stroke 0
HeartDiseaseorAttack 0
PhysActivity 0
Fruits 0
Veggies 0
HvyAlcoholConsump 0
AnyHealthcare 0
NoDocbcCost 0
GenHlth 0
MentHlth 0
PhysHlth 0
DiffWalk 0
Sex 0
Age 0
Education 0
Income 0
dtype: int64df.head()Loading...
df.describe().TLoading...
Visualize the Distributions
n_cols = 3  # Number of columns
n_rows = 8  # Number of rows (in this case 8 for 22 images)

# Build a histogram
df.hist(layout=(n_rows, n_cols), figsize=(12, 20), bins=20)  # Anda dapat menyesuaikan figsize sesuai kebutuhan
plt.tight_layout()
plt.show()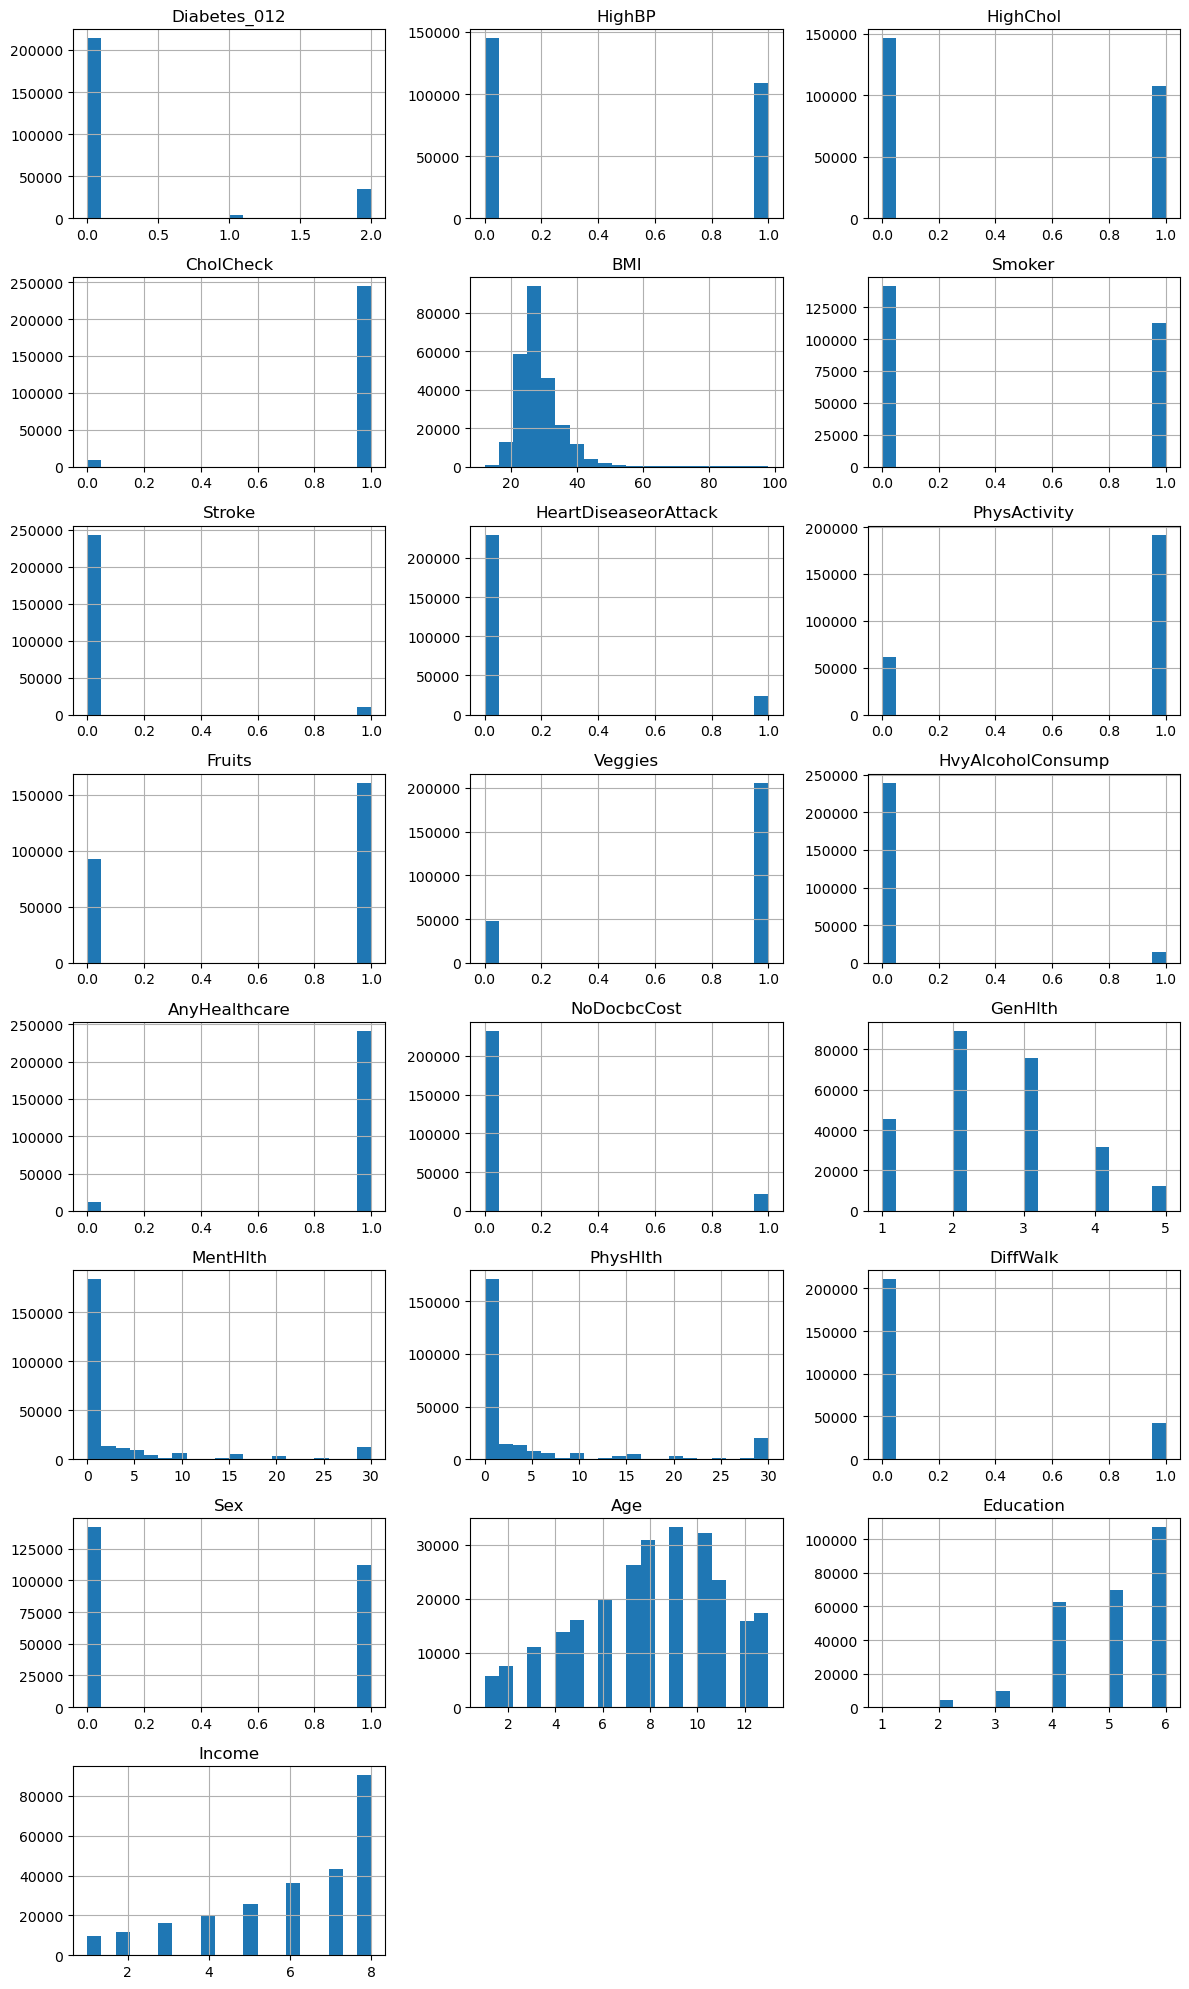
n_cols = 3  # Number of columns
n_rows = 8  # Number of rows (in this case 8 for 22 images)

# Build a boxplot
df.plot(kind='box', subplots=True, layout=(n_rows, n_cols), figsize=(12, 20), sharex=False, sharey=False)
plt.tight_layout()
plt.show()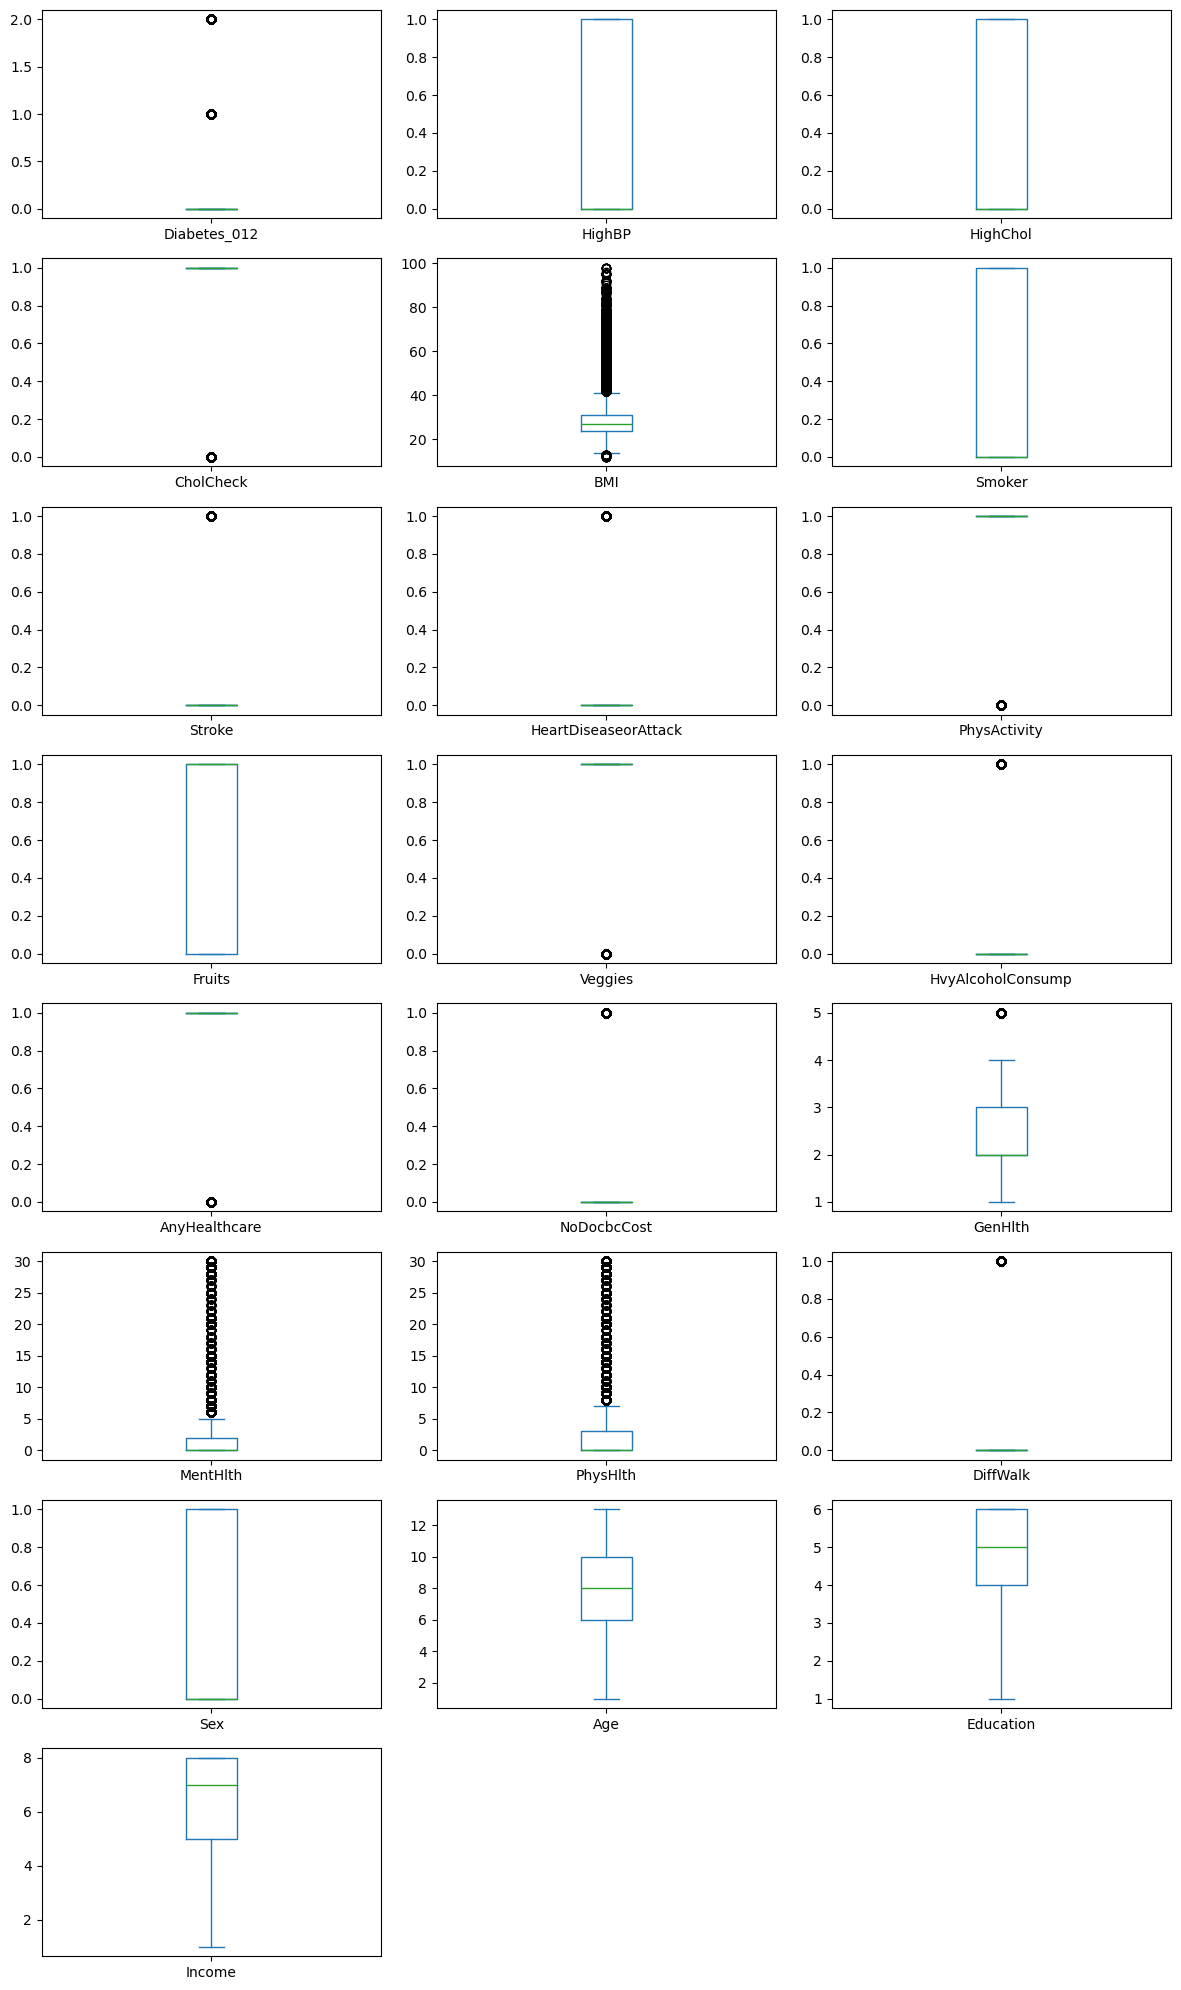
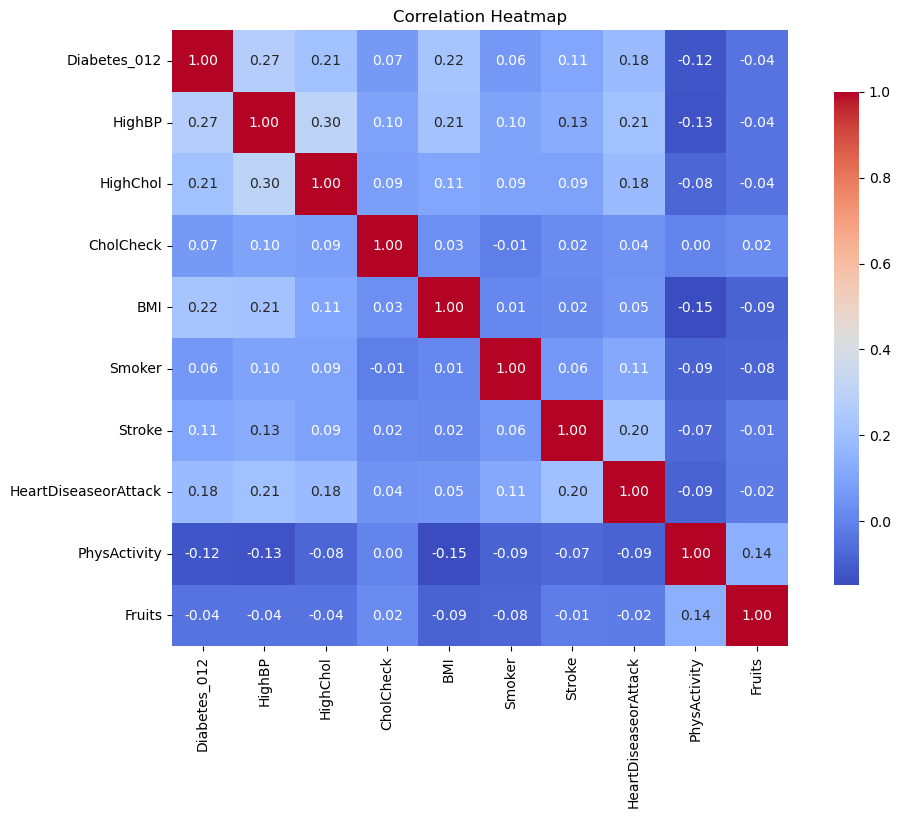
# Subset some of the more interesting columns
final_data = df[['Diabetes_012', 'HighBP', 'HighChol', 'CholCheck', 'BMI',
                  'Smoker', 'Stroke', 'HeartDiseaseorAttack',
                  'PhysActivity', 'Fruits']]
# Calculate the correlation matrix
corr_matrix = final_data.corr()
# Plot a heatmap
plt.figure(figsize=(12, 8))
sns.heatmap(corr_matrix, annot=True, cmap='coolwarm', fmt='.2f', square=True, cbar_kws={"shrink": .8})
plt.title('Correlation Heatmap')
plt.show()