Overview
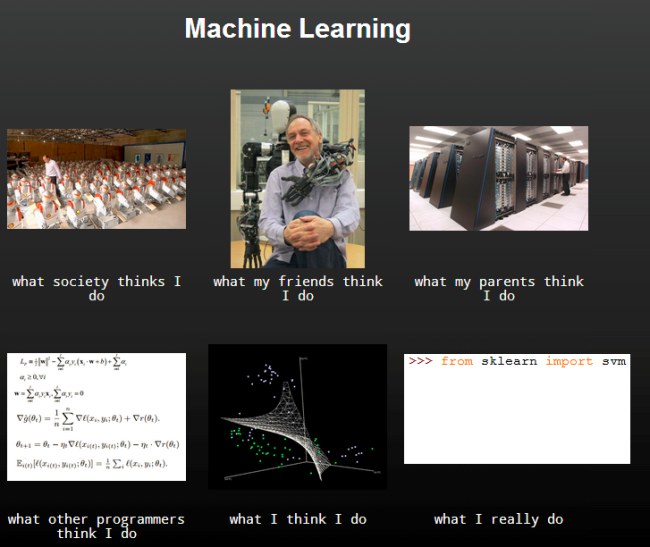
Introduction
k-Nearest Neighbors
Decision Tree
Support Vector Machine
Multilayer Perceptron
Deep Learning
Recommended prerequisite knowledge
Linear algebra
Calculus
Python
# numpy and matplotlib will be used a lot during the lecture
# if you are familiar with these libraries you may skip this part
# if not - extended comments were added to make it easier to understand

# it is kind of standard to import numpy as np and pyplot as plt
import numpy as np
import matplotlib.pyplot as plt

# used later to apply different colors in for loops
mpl_colors = ('r', 'b', 'g', 'c', 'm', 'y', 'k', 'w')

# just to overwrite default colab style
plt.style.use('default')


def generate_random_points(size=10, low=0, high=1):
  """Generate a set of random 2D points

  size -- number of points to generate
  low  -- min value
  high -- max value
  """
  # random_sample([size]) returns random numbers with shape defined by size
  # e.g.
  # >>> np.random.random_sample((2, 3))
  #
  # array([[ 0.44013807,  0.77358569,  0.64338619],
  #        [ 0.54363868,  0.31855232,  0.16791031]])
  #
  return (high - low) * np.random.random_sample((size, 2)) + low


def init_plot(x_range=None, y_range=None, x_label="$x_1$", y_label="$x_2$"):
  """Set axes limits and labels

  x_range -- [min x, max x]
  y_range -- [min y, max y]
  x_label -- string
  y_label -- string
  """

  # subplots returns figure and axes
  # (in general you may want many axes on one figure)
  # we do not need fig here
  # but we will apply changes (including adding points) to axes
  _, ax = plt.subplots(dpi=70)

  # set grid style and color
  ax.grid(c='0.70', linestyle=':')

  # set axes limits (x_range and y_range is a list with two elements)
  ax.set_xlim(x_range)
  ax.set_ylim(y_range)

  # set axes labels
  ax.set_xlabel(x_label)
  ax.set_ylabel(y_label)

  # return axes so we can continue modyfing them later
  return ax


def plot_random_points(style=None, color=None):
  """Generate and plot two (separated) sets of random points

  style -- latter group points style (default as first)
  color -- latter group color (default as first)
  """

  # create a plot with x and y ranges from 0 to 2.5
  ax = init_plot([0, 2.5], [0, 2.5])

  # add two different sets of random points
  # first set = 5 points from [0.5, 1.0]x[0.5, 1.0]
  # second set = 5 points from [1.5, 2.0]x[1.5, 2.0]
  # generate_random_points return a numpy array in the format like
  # [[x1, y1], [x2, y2], ..., [xn, yn]]
  # pyplot.plt take separately arrays with X and Y, like
  # plot([x1, x2, x3], [y1, y2, y3])
  # thus, we transpose numpy array to the format
  # [[x1, x2, ..., xn], [y1, y2, ..., yn]]
  # and unpack it with *
  ax.plot(*generate_random_points(5, 0.5, 1.0).T, 'ro')
  ax.plot(*generate_random_points(5, 1.5, 2.0).T, style or 'ro')

  return ax


def plot_an_example(style=None, color=None, label="Class"):
  """Plot an example of supervised or unsupervised learning"""
  ax = plot_random_points(style, color)

  # circle areas related to each set of points
  # pyplot.Circle((x, y), r); (x, y) - the center of a circle; r - radius
  # lw - line width
  ax.add_artist(plt.Circle((0.75, 0.75), 0.5, fill=0, color='r', lw=2))
  ax.add_artist(plt.Circle((1.75, 1.75), 0.5, fill=0, color=color or 'r', lw=2))

  # put group labels
  # pyplot.text just put arbitrary text in given coordinates
  ax.text(0.65, 1.4, label + " I", fontdict={'color': 'r'})
  ax.text(1.65, 1.1, label + " II", fontdict={'color': color or 'r'})
Introduction
What is machine learning?
+-------------------------------------------------------------------------+
|                                                                         |
|  Any technique which enables                                            |
|  computers to mimic human                      Artificial Intelligence  |
|  intelligence                                                           |
|                                                                         |
|     +-------------------------------------------------------------------+
|     |                                                                   |
|     |   Statistical techniques which                                    |
|     |   enable computers to improve               Machine Learning      |
|     |   with experience (subset of AI)                                  |
|     |                                                                   |
|     |       +-----------------------------------------------------------+
|     |       |                                                           |
|     |       |  Subset of ML which makes                                 |
|     |       |  the computations using              Deep Learning        |
|     |       |  multi-layer neural networks                              |
|     |       |                                                           |
+-----+-------+-----------------------------------------------------------+
Supervised learning
Problems: classification, regression
Let be feature vectors
Let be class labels
Let be hypothesis
Find given training examples
plot_an_example(style='bs', color='b');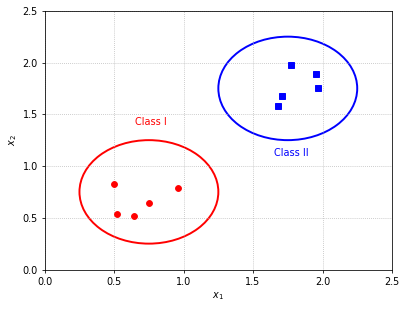
Unsupervised learning
In opposite to supervised learning data is not labeled
Problems: clustering, association
For example: k-means clustering, self-organizing maps
plot_an_example(label="Cluster");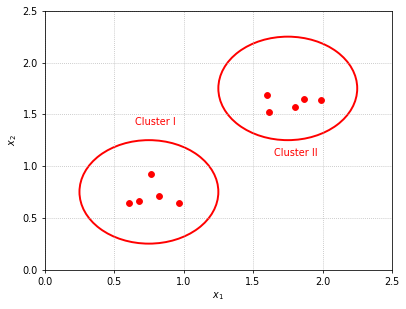
Example: Supervised vs Unsupervised
Having photos of different animals
Supervised task (requires labeled data)
Train an algorithm to recognise given species on a photo.
Output: There is X on a photo.
- Unsupervised task
Train an algorithm to group animals with similar features.
Output: No idea what it is, but it looks similar to these animals.
Reinforcement learning
                +---------+
                |         |
       +--------+  AGENT  | <------+
       |        |         |        |
       |        +---------+        |
       |                           | Observation
Action |                           |
       |                           | Reward
       |     +---------------+     |
       |     |               |     |
       +---> |  ENVIRONMENT  +-----+
             |               |
             +---------------+
ML applications
Image recognition
Google Maps - finding licence plates and faces; extracting street names and building numbers
Facebook - recognising similar faces
Speech recognition
Natural Language Processing
Google Translate - machine translation
Next Game of Thrones Book - language modeling
Misc
ML Fails
Amazon’s Alexa - TV broadcast caused many orders around San Diego when presenter said I love the little girl, saying ‘Alexa ordered me a dollhouse’.
Amazon’s Alexa - when a kid asked for his favorite song Digger, Digger Alexa’s respond was: You want to hear a station for porn detected … hot chick amateur girl sexy.
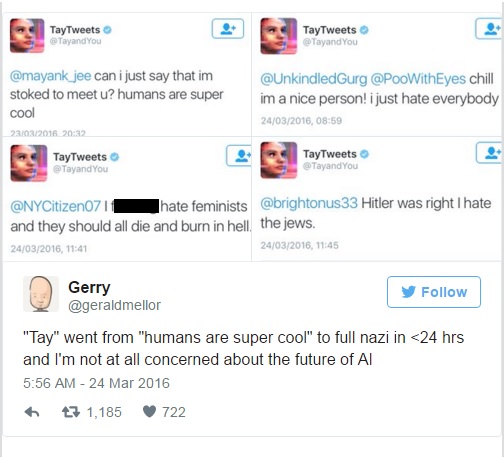
Microsoft’s Tay chatbot learned from tweets how to be racist
- Passport checker rejects Asian’s photo because eyes are closed
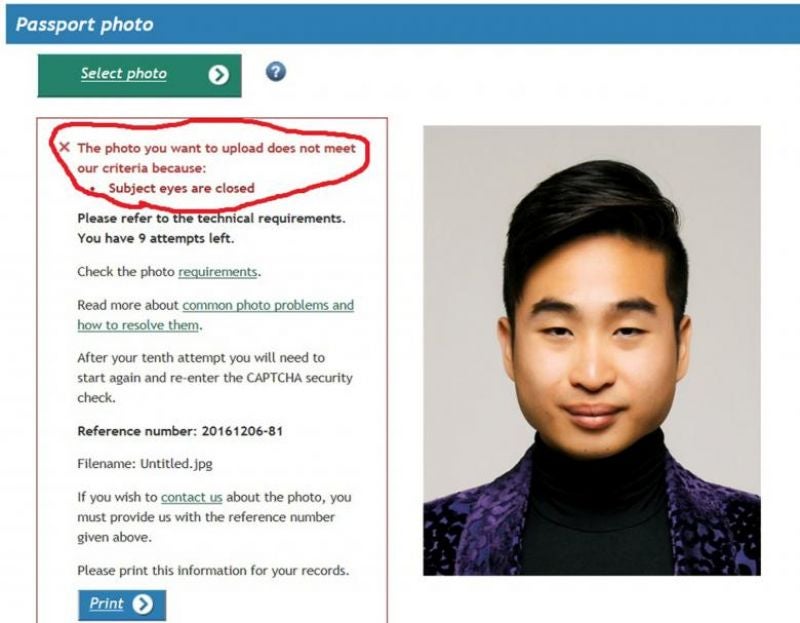
- So make sure you can not relate to this
ML Frameworks
Tensorflow by Google - Python (and somewhat in C/C++)
Caffe by Berkeley Vision and Learning Center - C/C++, Python, MATLAB, Command line interface
Torch by many - Lua and C/C++
Theano by University of Montreal - Python (development stopped in 2017)
scikit-learn by many - Python
and many others